










Jedna aplikacja,
​wiele obszarów pracy

Enerace.online nie ogranicza się do jednego wykresu czy jednego raportu. To zestaw funkcji, które wspierają monitoring rynku, analizę kontraktów, kontrolę kosztów i codzienne podejmowanie decyzji zakupowych.

Market Data
​and Analysis

Historical Data and Market Data
A desk with a laptop on the table
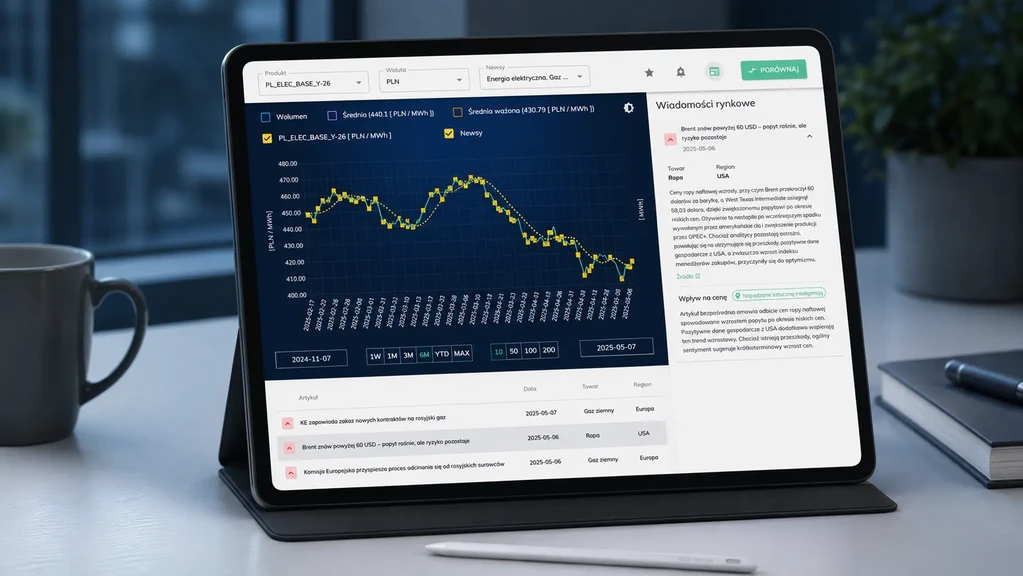
Access to historical data on Enerace.online gives you an edge by allowing you to track your purchases in the context of broader market trends. This enables you to better understand the market, identify areas for optimization, and, most importantly, make more informed purchasing decisions.
Market Reports
A desk with a laptop on the table
The daily, weekly, and monthly market reports on Enerace.online bring order to the chaos of energy market information. Instead of having to search for and analyze dozens of sources on your own, you receive a ready-made, easy-to-understand summary of the key factors affecting prices—you save time and can be sure you won’t miss anything important.
Portfolio Reports
A desk with a laptop on the table
Every week, you receive a report tailored to your company and specific contracts. Enerace.online shows the current status of your procurement portfolio, the level of strategy implementation, the market situation relative to your portfolio, and recommendations for action in the coming periods.
Market News with Analysis
A desk with a laptop on the table
You receive market information along with an analysis of how it affects prices. Not just what happened, but also what it means. This makes it easier to understand the situation quickly without having to analyze multiple sources.
Price Rebound Analysis
A desk with a laptop on the table
Price reversal analysis helps identify the moment a market trend changes. You can see whether declines or rallies might be coming to an end and when it’s worth considering taking action. This supports decision-making in less obvious situations, before the change becomes apparent to everyone.
Energy mix and system data
A desk with a laptop on the table
You can see the structure of energy production in each European country. This gives you a better understanding of what drives price changes. As a result, you get a broader view of the market, rather than just looking at it through the lens of a single chart.
Gas Storage Levels
A desk with a laptop on the table
Track gas storage levels in Europe and compare data across years. This view helps you assess whether the market is prepared for the winter season and when large-scale purchases of gas for storage may affect price volatility.

Market Monitoring
​and Signals

A desk with a laptop on the table

Price Alerts

Alerts notify you when the price reaches a certain level or a buy signal appears. You don't have to constantly monitor the market—the system does it for you. This allows you to react more quickly to changes and ensures you don't miss important moments.
A desk with a laptop on the table

Buy Signals

Buy signals show where the current price stands relative to historical data and risk levels. This lets you see whether you’re in an opportunity zone, a neutral zone, or a risky zone—and makes it possible to make decisions based on data rather than gut feeling.
A desk with a laptop on the table

Market News with AI Analysis

Keep track of the most important market events, along with their interpretation and an assessment of their impact on prices. You can analyze the news on your own or directly on the chart—this way, you can see what actually influenced price changes at any given moment.

Your Situation
​and Portfolio Management

A desk with a laptop on the table

Contract Status

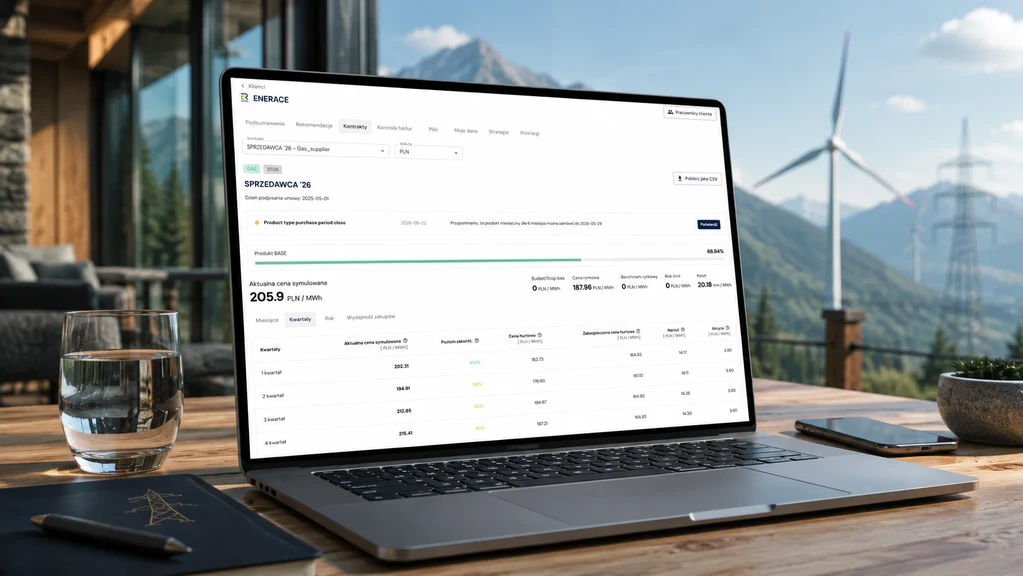
The contract overview lets you see which volumes are hedged and which periods require a decision. You have a complete picture of your energy portfolio in one place. This makes it easier to plan your next steps and avoid making decisions on a whim.
A desk with a laptop on the table

Comparison of Consumption
​(Plan vs. Actual)

You compare your contracted consumption with your actual consumption. You can see any discrepancies and respond more quickly. This helps you better control costs and avoid unforeseen situations.
A desk with a laptop on the table

Prices and Costs
​in Various Currencies

The ability to work with data in the currency of your choice simplifies analysis and reporting. This allows you to better tailor the data to the realities of your organization.
A desk with a laptop on the table

Dashboard – a single
​view of your situation

The dashboard brings together the most important information about the market, contracts, and the relationship between price and budget in one place. You don’t analyze the data in isolation—you see its real impact on the company. This reduces analysis time and makes it easier to move from data to decisions.

Decisions
​and Operational Optimization

A desk with a laptop on the table

PowerShift

PowerShift supports decisions related to energy production and consumption at specific times of the day in your company by using 15-minute and hourly prices from the Day-Ahead Market (DAM). This makes it easier to align operational activities with current market conditions and better control energy costs.
A desk with a laptop on the table

Carbon footprint

You can analyze the emissions profile and energy sources in your portfolio. This supports ESG-related decisions and reporting.
A desk with a laptop on the table

Purchasing Power

Compare your current price with market benchmarks and see how your purchasing decisions stack up. Enerace.online shows a comparison with the average market price, the current market price, and the price you could have obtained if you had purchased 100% of the volume on the day the contract was signed.

Invoice and
​Expense Review

A desk with a laptop on the table

Invoice Verification

Check whether invoices from suppliers and distributors match the rates, the contract, and your actual usage. This helps you eliminate billing errors and ensures that you aren’t overpaying.
A desk with a laptop on the table

Exceedance Alerts

The system detects instances where contracted power is exceeded, reactive power costs, and other deviations that affect distribution charges. This allows you to respond quickly and reduce unnecessary costs.
A desk with a laptop on the table

Consumption Monitoring

Compare actual consumption with projected and contracted levels to identify discrepancies and their impact on costs. This helps you better understand the causes of these discrepancies and take corrective action.
A desk with a laptop on the table

Energy Cost Structure

Analyze energy, distribution, and tax costs all in one place. This lets you see what actually makes up the final price and where there are opportunities for optimization.
A desk with a laptop on the table

Financial and Budgetary Support

Track actual costs against the budget and analyze variances.
This provides the finance department with up-to-date data for monitoring and planning expenses.

New features that
​we've just rolled out

We’re constantly developing the app to better support you in your day-to-day work with ​the energy and gas markets. Here are the latest features that have just been added to Enerace.Online
PowerShift
June 15, 2026

PowerShift

Dynamic support for decisions related to energy consumption and production.
AI Analysis
June 15, 2026

AI Analysis

Market news & AI-powered price impact analysis in Enerace.Online.
Export to XLS
June 15, 2026

Export to XLS

Export of tenders to XLS (consultants and clients only).

Show more

See how
​Enerace.online works

Enerace.online organizes market data, analyses, and all the most important insights in one place. This helps you understand the energy and gas market more quickly, assess the best time to buy more accurately, and gain real control over your costs.

Try it free for 14 days

Smartphones on which the website is displayed incorrectly